NEW: For readers using a smartphone, the pages here (all pages on website) are now available in a mobile format. The format is Google’s new AMP (Accelerated Mobile Pages.) You may have to configure your browser to activate it. AMP format automatically adjust for a mobile view for easy reading and it also loads much faster. 
Crude: I was very glad to add the Crude Oil short strangle this week: the APR2019 100 CALL and the 50 PUT. The very wide strangle should remain outside whatever news will dominate oil prices the rest of the calendar year and beyond. Basis the DEC18 Crude Oil contract, I remain short the 55 PUT, and both the 85 and 90 CALL strikes – all profitable at this point in time. I will be watching this class (DEC18 Crude Oil options) closely and will be quite willing to take profits on all three of these strikes – even though they expire in only 23 days. My thinking on this presently, is that: 1) For now, I see little point in risking these profits while trying to hold out for the small amount left to gain in them. And 2) I still remain short the JAN2019 50 PUT and the 90 CALL with 53 days until expiration (on 14 DEC 2918.)
There are a number of factors that could be influencing oil prices for a long while yet. It seems to be that – the less certain the future is, the longer the list of possible threats becomes. The news media of all types, including the financial channels, seems to merely grow this list longer at times when there isn’t a major story to ride above the rest: The media’s soup du jour now lists many ingredients: Saudi Arabia – United States of America relations, international missile treaties, the Chinese economy, domestic elections (USA) in November, a possible rate hike in DEC18 by the Fed (USA), possible fund liquidation in the USA stock market, wage hikes and inflation – and this list continues to grow.
Natural Gas: I remain short the NG DEC18 short 3.750-strike CALL. Prices for the DEC18 contract seems to have now factored the bullish news that supplies and production have brought. The DEC18 futures closed Friday near 3.293 – and that seems to be a bit over-bought in the face of lower demand price trends for the Northern Hemisphere transition from the “seasonal shoulder” (price dip) between the fall and winter seasons. I can’t completely dismiss any threats to my short 3.75-strike, but the market’s fundamentals and seasonal price behavior suggests that a top may have been made. I continue to hold this trade while looking forward to selling a PUT(s) on the early 2019 contracts prior to colder weather.
Gold: A great many analyst are suggesting that speculative traders should consider buying dips in Gold prices and/or purchase bull spreads in option plays. I would point out that – until those two recent days where the stock’s DOW average dropped 1,000 points- none of these analyst were recommending any long gold positions in futures or options. Historically, gold prices will go up (the ‘safe haven effect’ is the name given to gold price rises as the stock market averages drop) when/if stocks go down. The operatives here are “if”, and then “how much?” That is why it is called speculation. I prefer a much safer speculation: That if gold prices do go UP, they will not exceed $1500 per ounce over the next 99 days, the expiration date my short strangle of the 1000 PUT and 1500-strike CALL expires. And of course I also hold the 1050 PUT / 1400 CALL DEC18 strangle that expires in 37 days, little more than a month away.
A Question I Received from a Reader/Subscriber: You may notice that my commentary often cites price patterns with the note that includes “Northern Hemisphere” when I mention specific seasons. This is because many international subscribers to the newsletter do not live North of the Equator. We have subscribers in 14 countries now as the newsletter continues to grow. I thank you all for your support.
A question and comment I received from a customer this week, referenced all the Crude Oil short strangle options I shopped in last week’s TRADE COMMENTARY of October 15, 2018 where I listed the prices and expiration for these classes of short strangles: source: 15OCT2018
At present the short 100C/50P JAN19 options are priced at a total of: 0.08 or $80. Days until Expiration: 63
At present the short 100C/50P FEB19 options are priced at a total of: 0.17 or $170. Days until Expiration: 96
At present the short 100C/50P MAR19 options are priced at a total of: 0.29 or $290. Days until Expiration: 125
At present the short 100C/50P APR19 options are priced at a total of: 0.43 or $430. Days until Expiration: 154
This reader asked, “As long as a trader has plenty of margin money, why isn’t trading ALL of those a good idea – and that way the trader might collect premium sales spread out over several months?” My reply was a resounding “Great Idea” so long as the trader choosing to do so has the margin money available. I call this extended strategy “building ladders of passive income,” and it is a great way, if you can afford it, to build additional income off of your research and trading decisions. I posted an entire article about this recently on my (free) blog: SellingCommodityOptions.com You can read the article at this link. I think markets where you can use the short-strangle strategy are particularly attractive to form these passive income ladders. Right now, I like crude oil and gold for this.
I wish to thank this reader for his question/comment. If you have a subject that could be ‘article worthy’ or maybe just a topic you would like to learn more about, please pass it on to me. I never use anyone’s name or email, so confidentiality is maintained at all times. Send it to: Don@WriteThisDown.com
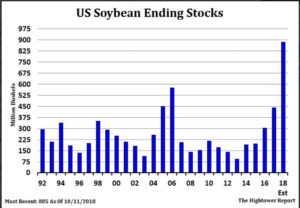
Corn and Soybeans: I don’t have anything new to comment on Corn, my views remain exactly the same as last week in 15OCT2018 commentary. The Soybean harvest progression and crop conditions continue the very bearish outlook for soybean prices. This illustration (below) posted at CME’s website indicates just how high the stocks are this year:
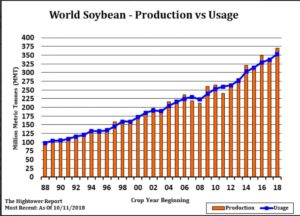
I hasten to add that while ending stocks have gone up, so has the world demand for soybeans:
An abundance of soybean stocks over the next year, coupled with the reluctance of China to buy product from the United States of America, bodes for plentiful supplies (at any price.) I will be shopping this week for some soybean CALL strikes to sell. Probably something at $10.00 bushel and higher. The seasonal price patterns for soybeans in the early months of the year is UP, so it is unusual to be shopping to sell CALLs at this time.
Here’s the Kansas State Univ supply-demand chart that includes the latest (OCT) WASDE:
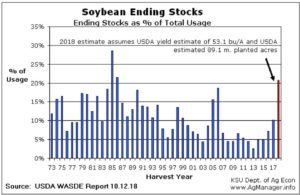
Just so you notice: This historical STU (stocks-to-use ratio) takes into account both supply and demand (unlike the previous two soybean charts just posted.) This is why we learn to rely heavily on STU charts for a reliable fundamental indicator. I am looking forward to the next USDA/ WASDE on November 8, 2018 (12 noon New York time.) Soybean numbers will likely continue to confirm abundant supplies.
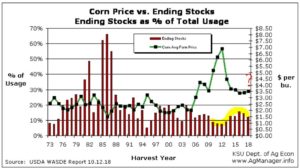
The WASDE Corn report in NOV18 could reduce the yield again; if this happens- it could be a turnaround trend for corn prices (which would be bullish over the longer term.) Here’s the KSU WASDE chart for OCT18 on corn:
You may recall, that I am forward-looking to shop to sell some Corn PUTS in the early contract MONTHS of 2019. The seasonal price in those months is UP, but it still may be a bit early for a bottom price yet because harvest is progressing at an increasing rate for now. For my recent notes on this see last week’s Trade Commentary.
That is all for now. Have a great week and good trading. – Don

Don A. Singletary
All of the 15-year average seasonal price chart patterns I use here and in the SellingCommodityOptions.com blog are in my book: Seasonal Commodity Charts – Designed by Mother Nature, available on Amazon in paperback (USA link)
The commentary and examples are for teaching purposes only and are not intended to be a trading or trade advisory service. Any investments, trades, and/or speculations made in light of the ideas, opinions, and/or forecasts, expressed or implied herein on the web site and/or newsletter, are committed at your own risk, financial or otherwise. Trading with leverage could lead to greater loss than your initial deposit. Trade at your own risk. Investors and traders are responsible for their own investment/trading decisions including entries, exits, position, sizing and use of stops or lack thereof. This is not a trade advisory service and is for educational purposes only. The content on the pages here is believed to be reliable - but we cannot guarantee it.


NEW: For readers using a smartphone, the pages here (all pages on website) are now available in a mobile format. The format is Google’s new AMP (Accelerated Mobile Pages.) You may have to configure your browser to activate it. AMP format automatically adjust for a mobile view for easy reading and it also loads much faster.
Crude: I was very glad to add the Crude Oil short strangle this week: the APR2019 100 CALL and the 50 PUT. The very wide strangle should remain outside whatever news will dominate oil prices the rest of the calendar year and beyond. Basis the DEC18 Crude Oil contract, I remain short the 55 PUT, and both the 85 and 90 CALL strikes – all profitable at this point in time. I will be watching this class (DEC18 Crude Oil options) closely and will be quite willing to take profits on all three of these strikes – even though they expire in only 23 days. My thinking on this presently, is that: 1) For now, I see little point in risking these profits while trying to hold out for the small amount left to gain in them. And 2) I still remain short the JAN2019 50 PUT and the 90 CALL with 53 days until expiration (on 14 DEC 2918.)
Natural Gas: I remain short the NG DEC18 short 3.750-strike CALL. Prices for the DEC18 contract seems to have now factored the bullish news that supplies and production have brought. The DEC18 futures closed Friday near 3.293 – and that seems to be a bit over-bought in the face of lower demand price trends for the Northern Hemisphere transition from the “seasonal shoulder” (price dip) between the fall and winter seasons. I can’t completely dismiss any threats to my short 3.75-strike, but the market’s fundamentals and seasonal price behavior suggests that a top may have been made. I continue to hold this trade while looking forward to selling a PUT(s) on the early 2019 contracts prior to colder weather.
Gold: A great many analyst are suggesting that speculative traders should consider buying dips in Gold prices and/or purchase bull spreads in option plays. I would point out that – until those two recent days where the stock’s DOW average dropped 1,000 points- none of these analyst were recommending any long gold positions in futures or options. Historically, gold prices will go up (the ‘safe haven effect’ is the name given to gold price rises as the stock market averages drop) when/if stocks go down. The operatives here are “if”, and then “how much?” That is why it is called speculation. I prefer a much safer speculation: That if gold prices do go UP, they will not exceed $1500 per ounce over the next 99 days, the expiration date my short strangle of the 1000 PUT and 1500-strike CALL expires. And of course I also hold the 1050 PUT / 1400 CALL DEC18 strangle that expires in 37 days, little more than a month away.
A Question I Received from a Reader/Subscriber: You may notice that my commentary often cites price patterns with the note that includes “Northern Hemisphere” when I mention specific seasons. This is because many international subscribers to the newsletter do not live North of the Equator. We have subscribers in 14 countries now as the newsletter continues to grow. I thank you all for your support.
A question and comment I received from a customer this week, referenced all the Crude Oil short strangle options I shopped in last week’s TRADE COMMENTARY of October 15, 2018 where I listed the prices and expiration for these classes of short strangles: source: 15OCT2018
This reader asked, “As long as a trader has plenty of margin money, why isn’t trading ALL of those a good idea – and that way the trader might collect premium sales spread out over several months?” My reply was a resounding “Great Idea” so long as the trader choosing to do so has the margin money available. I call this extended strategy “building ladders of passive income,” and it is a great way, if you can afford it, to build additional income off of your research and trading decisions. I posted an entire article about this recently on my (free) blog: SellingCommodityOptions.com You can read the article at this link. I think markets where you can use the short-strangle strategy are particularly attractive to form these passive income ladders. Right now, I like crude oil and gold for this.
I wish to thank this reader for his question/comment. If you have a subject that could be ‘article worthy’ or maybe just a topic you would like to learn more about, please pass it on to me. I never use anyone’s name or email, so confidentiality is maintained at all times. Send it to: Don@WriteThisDown.com
Corn and Soybeans: I don’t have anything new to comment on Corn, my views remain exactly the same as last week in 15OCT2018 commentary. The Soybean harvest progression and crop conditions continue the very bearish outlook for soybean prices. This illustration (below) posted at CME’s website indicates just how high the stocks are this year:
I hasten to add that while ending stocks have gone up, so has the world demand for soybeans:
An abundance of soybean stocks over the next year, coupled with the reluctance of China to buy product from the United States of America, bodes for plentiful supplies (at any price.) I will be shopping this week for some soybean CALL strikes to sell. Probably something at $10.00 bushel and higher. The seasonal price patterns for soybeans in the early months of the year is UP, so it is unusual to be shopping to sell CALLs at this time.
Here’s the Kansas State Univ supply-demand chart that includes the latest (OCT) WASDE:
Just so you notice: This historical STU (stocks-to-use ratio) takes into account both supply and demand (unlike the previous two soybean charts just posted.) This is why we learn to rely heavily on STU charts for a reliable fundamental indicator. I am looking forward to the next USDA/ WASDE on November 8, 2018 (12 noon New York time.) Soybean numbers will likely continue to confirm abundant supplies.
The WASDE Corn report in NOV18 could reduce the yield again; if this happens- it could be a turnaround trend for corn prices (which would be bullish over the longer term.) Here’s the KSU WASDE chart for OCT18 on corn:
You may recall, that I am forward-looking to shop to sell some Corn PUTS in the early contract MONTHS of 2019. The seasonal price in those months is UP, but it still may be a bit early for a bottom price yet because harvest is progressing at an increasing rate for now. For my recent notes on this see last week’s Trade Commentary.
That is all for now. Have a great week and good trading. – Don
Don A. Singletary
All of the 15-year average seasonal price chart patterns I use here and in the SellingCommodityOptions.com blog are in my book: Seasonal Commodity Charts – Designed by Mother Nature, available on Amazon in paperback (USA link)
free Prime Shipping USA
The commentary and examples are for teaching purposes only and are not intended to be a trading or trade advisory service. Any investments, trades, and/or speculations made in light of the ideas, opinions, and/or forecasts, expressed or implied herein on the web site and/or newsletter, are committed at your own risk, financial or otherwise. Trading with leverage could lead to greater loss than your initial deposit. Trade at your own risk. Investors and traders are responsible for their own investment/trading decisions including entries, exits, position, sizing and use of stops or lack thereof. This is not a trade advisory service and is for educational purposes only. The content on the pages here is believed to be reliable - but we cannot guarantee it.