Corn: December Corn closed at the highest level since August 21st on Friday. The USDA/WASDE monthly (World Ag Supply-Demand Estimate) is to be released at Noon (Eastern Time/NYC) this Thursday, October 11. The market is expected to get more bearish news due to record high yields (last report was 181.3 bushels/acre). This could be somewhat offset by heavy rains in corn producing regions in the United States that might cause harvest delays. For those of you that might be short the DEC18 Corn CALLs, this week’s WASDE report, if the yields stay at record levels, might be able to see some positive results for those trades.

The Economy and Commodities: There are few things more confusing than trying to guess the general economy, the $US Dollar strength, and inflation rates. There is presently a tilt towards inflationary pressures in the economy. Here’s an excerpt from a Bloomberg article indicating the latest CFO survey by Duke University reveals expected wage increases that could be coming up:
“An index of CFO sentiment was little changed at 71.1 after a first-quarter reading of 71.2 that was the highest since the survey began in 1996, according to a report Wednesday from Duke University’s Fuqua School of Business and CFO Magazine. The survey of 228 companies was conducted from May 22 to June 8. Companies expect wages and salaries to increase 4.1 percent on average over the next 12 months, up from a 3.9 percent average in the previous survey. Low unemployment is putting pressure on U.S. firms, as 41 percent of CFOs said attracting and retaining qualified employees was among their main concerns — the biggest share of any choice (in the survey).”
source: Bloomberg
Historically, during inflationary times, commodity prices rise as fund money supports commodity prices. Increased tariffs, higher interest rates, increases in wages, higher energy prices, and a rush by businesses to buy commodities ahead of higher prices – are all factors believed to support inflation. Fortunately, for option-sellers, we (at present) have a much shorter time-line and hopefully we are short strike prices far enough OTM (out-of-the-money) to find relative safety from broader more long-term trends.
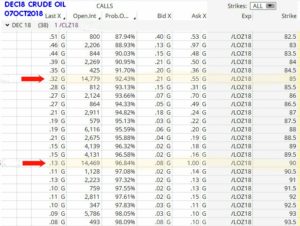
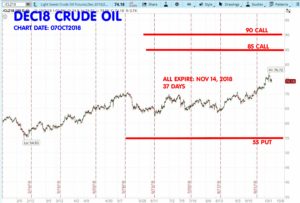
Crude Oil: Iran exports are the third largest in the world, about 3 million barrels a day. The beginning of November is the deadline for the sanctions. Of course politics and on-going negotiations are in play as to what really happens. Russia has hinted they will pump more oil. Saudi Arabia / OPEC suggests they can make up 1.3 million barrels per day. The United States production of crude oil has increased by 2.8 million barrels per day since September 2016 and there has been an increase of just over a million barrels per day in the first five months of this year. How “nice” it is of all these world oil producers to step up to “help out” with more production while crude oil is at a 3.5 year high price near $US 74 a barrel.
If you want a longer read on the Iranian sanctions, you can visit this article from CNBC: LINK In this article, is a comment from Goldman-Sachs:
“While upside price risks will prevail for now, fundamental data outside of Iran has not turned bullish in our view,”  Goldman said in a note to clients.
“We expect fundamentals to gradually become binding by early 2019 as new spare capacity comes online… pointing to the global market eventually returning into a modest surplus in early 2019.”
I have held my short Crude Oil strangles in DEC18 and JAN19 longer than I normally would. Perhaps I have underestimated the motivation of world oil producers to capitalize on the Iranian sanctions and to ride the tide of all the inflation-talk in the media. The draw-downs on my short DEC18 85-strike CALLs and 90-strike CALLs have moderated in the last few trading days- and these options expire in about 37 days on November 14.
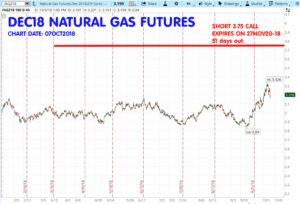
Natural Gas: As I illustrated in last week’s commentary, the 15-year average prices for the DEC NG contract are neutral-to-down this time of year. One thing that could thwart this price history pattern – is to have an unexpected very cold start to a winter in North America. This Wednesday, October 10, the Winter Fuels Outlook report from the EIA is due. see: WINTER HEATING FUELS.
Gold: I am currently short: DEC18 Gold 1400-CALLs and the 1050-PUTs. Both of these strikes expire on 27 NOV 2018, about 50 days out. Originally, back on 20 of JUN 2018 (see Trade Summary sheet), I sold the 1700C/1050P strangle. I have since closed the 1700 CALL for a profit, and then later sold the 1400 CALL (now short) to get back into a short strangle position. I expect some volatility in gold prices between now and the expiration for this 1400C/1050P strangle(s), but it seems the range of 1400-1050 is not likely to be threatened in the days remaining in this trade. Just a reminder that there is an inverse correlation between $US Dollar and Gold futures.
By the way, the relationship between Grain prices and the $US Dollar is also inverse; as the $US Dollar is stronger, this makes our grain exports more expensive to foreign buyers; this inverse relationship is often the reason that grain prices will go UP on days when the $US Dollar goes DOWN (effective lower grain prices become more attractive to foreign buyers.) Grains are cheaper for foreign buyers when the $US Dollar goes down; this means the foreign currency buys more dollars (when the dollar is weaker on the currency exchange.)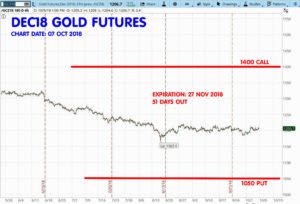
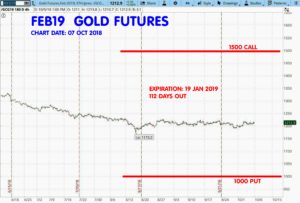
I am also short FEB2019 strangles on Gold, the 1500 CALL and 1000 PUT at 0.14 ($140) (see trade summary sheet date of 9/11/2018.) This is a nice wide range and these options expire on 19 JAN 2019, about 112 days out. At this time, both the 1500 CALL and the 1000 PUT have a “Prob OTM” (Probability of expiring Out-of-the-Money) of just over 98%.
If your trading software does not have the “Prob. OTM” as an available parameter in its option matrix, no problem: Just subtract the option’s delta from 1.0 and multiply by 100. Example: Option Delta = 0.03 1.0 minus 0.03 = .97 x 100 = 97% This rule of thumb is very accurate.
More Comments: I have updated the tabs on this website named Resource: Link Library This is still a work in progress and I will continue to add links that can help you find trading resources.
I checked with more than half a dozen brokers this last week and NONE of them is allowed (due to very strict ICE InterContinential Exchange policy) to offer FREE real-time or delayed quotes for traders via their brokers. They charge a $1300 a year fee for quotes on ICE commodities which include: orange juice/ FCOJ, Cocoa, Cotton, and Coffee. In previous years, the major exchanges have allowed free delayed quotes, but the ICE does not at present — and in spite of many requests— has been unbending on this policy. I wish it weren’t so. The fees per month of $US 110 to $130 are charged by any broker in order to allow ICE quotes to any domestic account.
Soybeans and Corn for Spring 2019: This calendar year is winding down. In next week’s commentary, I’ll be discussing some grain seasonal price patterns for Northern Hemisphere Spring & Summer. As soon as my Gold DEC18 short strangles are done, I will be looking to sell more short strangles in JAN19 and MAR19 option classes. And by the middle of NOV2018, I’ll take a look at more Crude Oil strangles and seasonal price patterns for early in 2019. I want to wait a few weeks on finding new short strangles for crude oil, that should be time enough to gauge the influences of the Iranian sanctions on world oil prices for the first quarter of 2019 and beyond.
Have a great week trading. – Don

Don A. Singletary
If you try to explain to a friend what Selling Commodity Options means, download the Patterns for Profits book and email it to 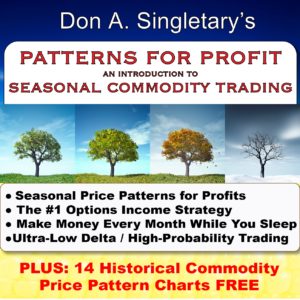 them. It’s a 33-page full color quick start packet of information that explains what we do. Get it here: http://bit.ly/PFProfit
Want a quick list of option expiration dates?
download HERE.
Want a list of FUTURES CONTRACT MONTHS, SYMBOLS, and MONTH CODES? download HERE.
The commentary and examples are for teaching purposes only and are not intended to be a trading or trade advisory service. Any investments, trades, and/or speculations made in light of the ideas, opinions, and/or forecasts, expressed or implied herein on the web site and/or newsletter, are committed at your own risk, financial or otherwise. Trading with leverage could lead to greater loss than your initial deposit. Trade at your own risk. Investors and traders are responsible for their own investment/trading decisions including entries, exits, position, sizing and use of stops or lack thereof. This is not a trade advisory service and is for educational purposes only. The content on the pages here is believed to be reliable - but we cannot guarantee it.


Corn: December Corn closed at the highest level since August 21st on Friday. The USDA/WASDE monthly (World Ag Supply-Demand Estimate) is to be released at Noon (Eastern Time/NYC) this Thursday, October 11. The market is expected to get more bearish news due to record high yields (last report was 181.3 bushels/acre). This could be somewhat offset by heavy rains in corn producing regions in the United States that might cause harvest delays. For those of you that might be short the DEC18 Corn CALLs, this week’s WASDE report, if the yields stay at record levels, might be able to see some positive results for those trades.
The Economy and Commodities: There are few things more confusing than trying to guess the general economy, the $US Dollar strength, and inflation rates. There is presently a tilt towards inflationary pressures in the economy. Here’s an excerpt from a Bloomberg article indicating the latest CFO survey by Duke University reveals expected wage increases that could be coming up:
Historically, during inflationary times, commodity prices rise as fund money supports commodity prices. Increased tariffs, higher interest rates, increases in wages, higher energy prices, and a rush by businesses to buy commodities ahead of higher prices – are all factors believed to support inflation. Fortunately, for option-sellers, we (at present) have a much shorter time-line and hopefully we are short strike prices far enough OTM (out-of-the-money) to find relative safety from broader more long-term trends.
Crude Oil: Iran exports are the third largest in the world, about 3 million barrels a day. The beginning of November is the deadline for the sanctions. Of course politics and on-going negotiations are in play as to what really happens. Russia has hinted they will pump more oil. Saudi Arabia / OPEC suggests they can make up 1.3 million barrels per day. The United States production of crude oil has increased by 2.8 million barrels per day since September 2016 and there has been an increase of just over a million barrels per day in the first five months of this year. How “nice” it is of all these world oil producers to step up to “help out” with more production while crude oil is at a 3.5 year high price near $US 74 a barrel.
If you want a longer read on the Iranian sanctions, you can visit this article from CNBC: LINK In this article, is a comment from Goldman-Sachs:
I have held my short Crude Oil strangles in DEC18 and JAN19 longer than I normally would. Perhaps I have underestimated the motivation of world oil producers to capitalize on the Iranian sanctions and to ride the tide of all the inflation-talk in the media. The draw-downs on my short DEC18 85-strike CALLs and 90-strike CALLs have moderated in the last few trading days- and these options expire in about 37 days on November 14.
Natural Gas: As I illustrated in last week’s commentary, the 15-year average prices for the DEC NG contract are neutral-to-down this time of year. One thing that could thwart this price history pattern – is to have an unexpected very cold start to a winter in North America. This Wednesday, October 10, the Winter Fuels Outlook report from the EIA is due. see: WINTER HEATING FUELS.
Gold: I am currently short: DEC18 Gold 1400-CALLs and the 1050-PUTs. Both of these strikes expire on 27 NOV 2018, about 50 days out. Originally, back on 20 of JUN 2018 (see Trade Summary sheet), I sold the 1700C/1050P strangle. I have since closed the 1700 CALL for a profit, and then later sold the 1400 CALL (now short) to get back into a short strangle position. I expect some volatility in gold prices between now and the expiration for this 1400C/1050P strangle(s), but it seems the range of 1400-1050 is not likely to be threatened in the days remaining in this trade. Just a reminder that there is an inverse correlation between $US Dollar and Gold futures.
I am also short FEB2019 strangles on Gold, the 1500 CALL and 1000 PUT at 0.14 ($140) (see trade summary sheet date of 9/11/2018.) This is a nice wide range and these options expire on 19 JAN 2019, about 112 days out. At this time, both the 1500 CALL and the 1000 PUT have a “Prob OTM” (Probability of expiring Out-of-the-Money) of just over 98%.
More Comments: I have updated the tabs on this website named Resource: Link Library This is still a work in progress and I will continue to add links that can help you find trading resources.
I checked with more than half a dozen brokers this last week and NONE of them is allowed (due to very strict ICE InterContinential Exchange policy) to offer FREE real-time or delayed quotes for traders via their brokers. They charge a $1300 a year fee for quotes on ICE commodities which include: orange juice/ FCOJ, Cocoa, Cotton, and Coffee. In previous years, the major exchanges have allowed free delayed quotes, but the ICE does not at present — and in spite of many requests— has been unbending on this policy. I wish it weren’t so. The fees per month of $US 110 to $130 are charged by any broker in order to allow ICE quotes to any domestic account.
Soybeans and Corn for Spring 2019: This calendar year is winding down. In next week’s commentary, I’ll be discussing some grain seasonal price patterns for Northern Hemisphere Spring & Summer. As soon as my Gold DEC18 short strangles are done, I will be looking to sell more short strangles in JAN19 and MAR19 option classes. And by the middle of NOV2018, I’ll take a look at more Crude Oil strangles and seasonal price patterns for early in 2019. I want to wait a few weeks on finding new short strangles for crude oil, that should be time enough to gauge the influences of the Iranian sanctions on world oil prices for the first quarter of 2019 and beyond.
Have a great week trading. – Don
Don A. Singletary
If you try to explain to a friend what Selling Commodity Options means, download the Patterns for Profits book and email it to them. It’s a 33-page full color quick start packet of information that explains what we do. Get it here: http://bit.ly/PFProfit
Want a quick list of option expiration dates?
download HERE.
Want a list of FUTURES CONTRACT MONTHS, SYMBOLS, and MONTH CODES? download HERE.
The commentary and examples are for teaching purposes only and are not intended to be a trading or trade advisory service. Any investments, trades, and/or speculations made in light of the ideas, opinions, and/or forecasts, expressed or implied herein on the web site and/or newsletter, are committed at your own risk, financial or otherwise. Trading with leverage could lead to greater loss than your initial deposit. Trade at your own risk. Investors and traders are responsible for their own investment/trading decisions including entries, exits, position, sizing and use of stops or lack thereof. This is not a trade advisory service and is for educational purposes only. The content on the pages here is believed to be reliable - but we cannot guarantee it.