Greetings:
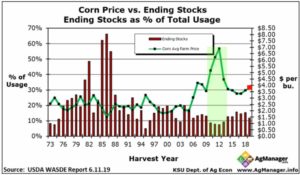
Corn: The KSU revised chart with JUNE19 WASDE numbers is here: You can see where the average to-farm prices were back in 2012 when the STU was below 10%. All the numbers are indicating that the STU when adjusted to the JULY 19 WASDE report will be below 10% again. A new crop planting report comes out today (Monday) at 4PM Eastern time. Last week the progress was 83% and about 15.7 million acres of corn remained unplanted. Even if today’s report comes in at 92%, that would still leave as much as 7.4 million unplanted corn acres. Today’s progress is expected to be 89% to 92%.


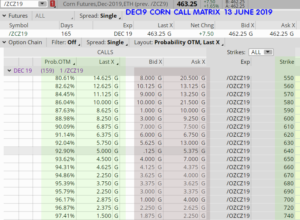
Here, I put up the DEC19 CALL options matrix. It shows the calls from strikes of 550 out to about 740. (Since this matrix was not during trading hours, but after hours, the BID/ASK is off, so go by the LAST X column (the last traded price at close on Friday.)

Right now I’m just “window shopping”, watching the price moves of these strikes, looking at the math Prob.OTM, and nobody knows how high high will be yet, nor do we know WHEN.
If the China trade talks make progress, there is all kinds of potential since they will import both corn and large amounts of ethanol from the USA. I’ll keep updating things in this market. Most of the corn farmers that are not in the ground yet, will likely stay out as there is as much as a 40% yield drop planting past June 16th. The soybeans are making a run also. The crop progress report today. Soybean planting is not as far behind yet because they can be planted later than corn. I’ll be following the bean market also, looking to sell CALLs. Corn stocks are expected to tighten a lot, soybeans not nearly as much.
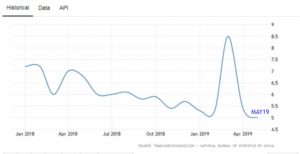
Crude Oil: The USA/China trade disputes seem to be taking toll in China, with new car sales taking a huge dip over the last six months. Also there is a huge drop in China’s Industrial production numbers. source: https://tradingeconomics.com/china/industrial-production
China’s industrial production increased 5 percent year-on-year in May 2019, easing from a 5.4 percent advance in April and missing market consensus of 5.5 percent. That was the weakest yearly growth in factory output since early 2002 amid an escalating trade dispute between Beijing and Washington, as production rose at a slower pace for both manufacturing (5 percent vs 5.3 percent in April) and utilities (5.9 percent vs 9.5 percent).

It is difficult to say how much of that is due to trade talks and how much it could be a sign of a weaker global economy. Crude Oil supplies are plentiful, demand is down, and there wasn’t much of a price spike when those tankers were attacked last week in the mid-East. Still, the DOW Industrial index is near record highs with the recent recovery.
Interest rates on USA treasuries have gone down, this happens when more of them are bought (bond prices go up, yields go down, etc.). The US Dollar ended the week strong. Gold prices basis OCT19 futures closed at $ US 1351 Friday, and when the global economy is weak, gold normally goes UP (the ‘safe haven effect’ it’s called.)
If Crude prices drop a bit more, that is expected to increase chances of a cutback in world oil production, aka: more renewals of production cutbacks. Will it be enough to support prices? At some point it would. I still want to sell some Crude Oil SEP19 PUT strikes, and will be watching crude this week. Also, when/if there are credible accounts of a slowing global economy, I will be looking to sell more GOLD PUT strikes probably out in the 2020 option classes.
So I’m shopping Corn CALLS, soybean CALLS, gold PUTS,and Crude PUTs – and will monitor things this week looking for opportunities.
Have a great week.- Don

Don A. Singletary
The commentary and examples are for teaching purposes only and are not intended to be a trading or trade advisory service. Any investments, trades, and/or speculations made in light of the ideas, opinions, and/or forecasts, expressed or implied herein on the web site and/or newsletter, are committed at your own risk, financial or otherwise. Trading with leverage could lead to greater loss than your initial deposit. Trade at your own risk. Investors and traders are responsible for their own investment/trading decisions including entries, exits, position, sizing and use of stops or lack thereof. This is not a trade advisory service and is for educational purposes only. The content on the pages here is believed to be reliable - but we cannot guarantee it.


Greetings:
Corn: The KSU revised chart with JUNE19 WASDE numbers is here: You can see where the average to-farm prices were back in 2012 when the STU was below 10%. All the numbers are indicating that the STU when adjusted to the JULY 19 WASDE report will be below 10% again. A new crop planting report comes out today (Monday) at 4PM Eastern time. Last week the progress was 83% and about 15.7 million acres of corn remained unplanted. Even if today’s report comes in at 92%, that would still leave as much as 7.4 million unplanted corn acres. Today’s progress is expected to be 89% to 92%.
Here, I put up the DEC19 CALL options matrix. It shows the calls from strikes of 550 out to about 740. (Since this matrix was not during trading hours, but after hours, the BID/ASK is off, so go by the LAST X column (the last traded price at close on Friday.)
Right now I’m just “window shopping”, watching the price moves of these strikes, looking at the math Prob.OTM, and nobody knows how high high will be yet, nor do we know WHEN.
If the China trade talks make progress, there is all kinds of potential since they will import both corn and large amounts of ethanol from the USA. I’ll keep updating things in this market. Most of the corn farmers that are not in the ground yet, will likely stay out as there is as much as a 40% yield drop planting past June 16th. The soybeans are making a run also. The crop progress report today. Soybean planting is not as far behind yet because they can be planted later than corn. I’ll be following the bean market also, looking to sell CALLs. Corn stocks are expected to tighten a lot, soybeans not nearly as much.
Crude Oil: The USA/China trade disputes seem to be taking toll in China, with new car sales taking a huge dip over the last six months. Also there is a huge drop in China’s Industrial production numbers. source: https://tradingeconomics.com/china/industrial-production
Interest rates on USA treasuries have gone down, this happens when more of them are bought (bond prices go up, yields go down, etc.). The US Dollar ended the week strong. Gold prices basis OCT19 futures closed at $ US 1351 Friday, and when the global economy is weak, gold normally goes UP (the ‘safe haven effect’ it’s called.)
If Crude prices drop a bit more, that is expected to increase chances of a cutback in world oil production, aka: more renewals of production cutbacks. Will it be enough to support prices? At some point it would. I still want to sell some Crude Oil SEP19 PUT strikes, and will be watching crude this week. Also, when/if there are credible accounts of a slowing global economy, I will be looking to sell more GOLD PUT strikes probably out in the 2020 option classes.
So I’m shopping Corn CALLS, soybean CALLS, gold PUTS,and Crude PUTs – and will monitor things this week looking for opportunities.
Have a great week.- Don
Don A. Singletary
The commentary and examples are for teaching purposes only and are not intended to be a trading or trade advisory service. Any investments, trades, and/or speculations made in light of the ideas, opinions, and/or forecasts, expressed or implied herein on the web site and/or newsletter, are committed at your own risk, financial or otherwise. Trading with leverage could lead to greater loss than your initial deposit. Trade at your own risk. Investors and traders are responsible for their own investment/trading decisions including entries, exits, position, sizing and use of stops or lack thereof. This is not a trade advisory service and is for educational purposes only. The content on the pages here is believed to be reliable - but we cannot guarantee it.