Corn
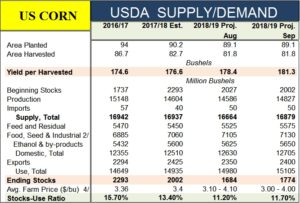
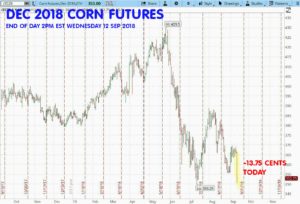
The USDA WASDE report 12 SEP 2018: The news for corn is bearish. The report increases the yield on the 2018-2019 United States corn crop from last month’s report: From 178.4 bushels/acre, up to 181.3. This was enough to convince the bulls (at least for now) that there will be plenty of corn next year. At 2PM EST the DEC18 (CZ8) contract closed at $3.53, down 13.75 cents for the day. After the market opens tomorrow, I will be shopping for DEC18 corn CALL options to sell. The estimated yield increase was unexpected. Had the USDA reduced that yield, the market could have just as easily gone up 13.75 cents today. Today’s report is probably key to setting the tone for DEC18 corn futures for a while. I wait a day or two to sell the corn CALLs because I want to make sure the market has time to digest today’s news.
Here’s a look at the chart for DEC18 corn today:
And here’s (see option matrix below) a look at the DEC18 class of corn options around 2:30 PM EST today. I’ve YELLOW highlighted the LAST X price traded, and also the Prob. OTM (Probability the options will expire Out-of-The-Money.) So if a trader wants to sell some DEC18 corn CALLs, this is the “menu” of Price-versus-Risk. Remember the price is in cents, and each cent represents $50. The next decision a call-selling trader has to make is an important one. The more premium you collect the more risk, or as they say in the trade, “gain is commensurate with risk.”
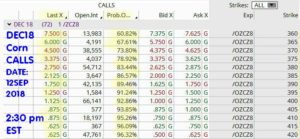
Of course all the numbers will change tomorrow. Corn could open UP or DOWN tomorrow. In commodity trading you will learn that a market can easily get ‘over done’ one way or the other. Sometimes, this results in a “bounce” in the other direction. My goal is make some money, not to try and guess the market. I only have try and determine where prices WILL NOT go and I think today’s numbers will eliminate a large move to the upside. Another thing, I should point out in the option matrix above: Look at the OpenInt (Open Interests.) You will see the strikes that end with a zero (0) have a higher OpenInt. The important point here is that you avoid trading options with LOW open interests. Why? The strikes with the highest OI, have the most volume and the most efficient pricing. In the art of trading options, the option matrix could be compared to a menu at your favorite restaurant. Bon appétit.
NOTE: If you don’t have a Prob. OTM in your trading platform available, no worries. Here a quick shortcut: Just get the delta of the option and subtract it from one (1.0). Example Delta = .08, then the Prob. OTM is 92% (1-.08) x 100 = 92%
SOYBEANS
You may recall, when I shorted the 1000-strike NOV18 soybeans, I put up information about the abundant supply for this year 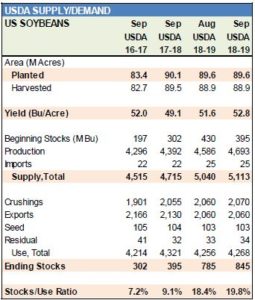 and next season (2018-19.) Today’s WASDE report re-confirms that. The yield was raised on the 2018-2019 crop from last month’s estimate of 51.6 up to 52.8 bushel/acre, adding another 107 million bushels in production.
And – as you see, the Stocks/Use ratio for the 2018-2019 is now up to 19.8%. You see that is more than double the 9.1% of this year (Sep 17-18.). If you are not familiar with reading these reports, this is a great example of how crop fundamentals would be determined as “bearish to neutral,” certainly not bullish. This doesn’t mean that the NOV18 soybean contract cannot go UP. In fact it went up today + 8.50 to a 840.25 price at close of market today. We option-sellers are not concerned about day-to-day price fluctuations but with the larger picture of crop fundamentals, basic supply-demand.
As soon as the Kansas State University website updates their charts, I will post them here with a link and credit to KSU for you to review.
CRUDE OIL:
The JAN19 (CLG9) closed near 69.94, up 1.05 after having been up by almost two dollars earlier in the day. There is concern that two major pipelines that run through South Caroline and North Carolina are in the path of hurricane Florence. This is on the United States Eastern coast where the storm will reach landfall in the next few days. There is a danger of electrical power outages and that would mean these major distribution pipelines could be shut down temporarily. In commodities, any supply interruptions usually cause higher prices. (This one hopefully is very temporary.) The EIA (United States of American Energy Information Service eia.gov) had a weekly report out today; for a copy go to: https://www.eia.gov/petroleum/supply/weekly/
The oil supplies are lower than last year at this time, but very close to the five-year average.
Note: My short DEC18 Crude Oil short $90-strike CALL gave up ground today. I had in a GTC order to buy it back (closing purchase) at 0.03, and it traded down to 0.04 and my order never got filled. Today that CALL ran back up to 0.08. Only today, with the “genius of hindsight” can I see what I should have done. I am not bothered by this, it is a common part of being an option-seller. But having it happen is always a reminder that we all risk existing profits when we hold a position. Choosing to continue a trade that is profitable – is a choice that puts existing profits at risk. Just because a profit is unrealized doesn’t mean it isn’t real.
GOLD
Both the DEC18 and FEB19 Gold futures up $10.00 today, the FEB19 trading near $1218 and the DEC18 near $1212. The $US Dollar index ($DXY) was down today. I put up a chart in a recent post about the inverse correlation of $US and GC prices.
see: https://www.timefarming.com/blog/10-september-2018-monday/ if you want to review that chart with Gold vs. $US Index.
That is all today. Thank you for your support.- Don
Don’t forget, you can download a list of futures symbols and month codes at: Symbols/Codes
If you are trying to explain to any of your acquaintances what we do,
just send them a copy of this, a free download:
Download free now at: http://bit.ly/PFProfit
The commentary and examples are for teaching purposes only and are not intended to be a trading or trade advisory service. Any investments, trades, and/or speculations made in light of the ideas, opinions, and/or forecasts, expressed or implied herein on the web site and/or newsletter, are committed at your own risk, financial or otherwise. Trading with leverage could lead to greater loss than your initial deposit. Trade at your own risk. Investors and traders are responsible for their own investment/trading decisions including entries, exits, position, sizing and use of stops or lack thereof. This is not a trade advisory service and is for educational purposes only. The content on the pages here is believed to be reliable - but we cannot guarantee it.


Corn
The USDA WASDE report 12 SEP 2018: The news for corn is bearish. The report increases the yield on the 2018-2019 United States corn crop from last month’s report: From 178.4 bushels/acre, up to 181.3. This was enough to convince the bulls (at least for now) that there will be plenty of corn next year. At 2PM EST the DEC18 (CZ8) contract closed at $3.53, down 13.75 cents for the day. After the market opens tomorrow, I will be shopping for DEC18 corn CALL options to sell. The estimated yield increase was unexpected. Had the USDA reduced that yield, the market could have just as easily gone up 13.75 cents today. Today’s report is probably key to setting the tone for DEC18 corn futures for a while. I wait a day or two to sell the corn CALLs because I want to make sure the market has time to digest today’s news.
Here’s a look at the chart for DEC18 corn today:
And here’s (see option matrix below) a look at the DEC18 class of corn options around 2:30 PM EST today. I’ve YELLOW highlighted the LAST X price traded, and also the Prob. OTM (Probability the options will expire Out-of-The-Money.) So if a trader wants to sell some DEC18 corn CALLs, this is the “menu” of Price-versus-Risk. Remember the price is in cents, and each cent represents $50. The next decision a call-selling trader has to make is an important one. The more premium you collect the more risk, or as they say in the trade, “gain is commensurate with risk.”
Of course all the numbers will change tomorrow. Corn could open UP or DOWN tomorrow. In commodity trading you will learn that a market can easily get ‘over done’ one way or the other. Sometimes, this results in a “bounce” in the other direction. My goal is make some money, not to try and guess the market. I only have try and determine where prices WILL NOT go and I think today’s numbers will eliminate a large move to the upside. Another thing, I should point out in the option matrix above: Look at the OpenInt (Open Interests.) You will see the strikes that end with a zero (0) have a higher OpenInt. The important point here is that you avoid trading options with LOW open interests. Why? The strikes with the highest OI, have the most volume and the most efficient pricing. In the art of trading options, the option matrix could be compared to a menu at your favorite restaurant. Bon appétit.
NOTE: If you don’t have a Prob. OTM in your trading platform available, no worries. Here a quick shortcut: Just get the delta of the option and subtract it from one (1.0). Example Delta = .08, then the Prob. OTM is 92% (1-.08) x 100 = 92%
SOYBEANS
You may recall, when I shorted the 1000-strike NOV18 soybeans, I put up information about the abundant supply for this year and next season (2018-19.) Today’s WASDE report re-confirms that. The yield was raised on the 2018-2019 crop from last month’s estimate of 51.6 up to 52.8 bushel/acre, adding another 107 million bushels in production.
And – as you see, the Stocks/Use ratio for the 2018-2019 is now up to 19.8%. You see that is more than double the 9.1% of this year (Sep 17-18.). If you are not familiar with reading these reports, this is a great example of how crop fundamentals would be determined as “bearish to neutral,” certainly not bullish. This doesn’t mean that the NOV18 soybean contract cannot go UP. In fact it went up today + 8.50 to a 840.25 price at close of market today. We option-sellers are not concerned about day-to-day price fluctuations but with the larger picture of crop fundamentals, basic supply-demand.
As soon as the Kansas State University website updates their charts, I will post them here with a link and credit to KSU for you to review.
CRUDE OIL:
The JAN19 (CLG9) closed near 69.94, up 1.05 after having been up by almost two dollars earlier in the day. There is concern that two major pipelines that run through South Caroline and North Carolina are in the path of hurricane Florence. This is on the United States Eastern coast where the storm will reach landfall in the next few days. There is a danger of electrical power outages and that would mean these major distribution pipelines could be shut down temporarily. In commodities, any supply interruptions usually cause higher prices. (This one hopefully is very temporary.) The EIA (United States of American Energy Information Service eia.gov) had a weekly report out today; for a copy go to: https://www.eia.gov/petroleum/supply/weekly/
The oil supplies are lower than last year at this time, but very close to the five-year average.
Note: My short DEC18 Crude Oil short $90-strike CALL gave up ground today. I had in a GTC order to buy it back (closing purchase) at 0.03, and it traded down to 0.04 and my order never got filled. Today that CALL ran back up to 0.08. Only today, with the “genius of hindsight” can I see what I should have done. I am not bothered by this, it is a common part of being an option-seller. But having it happen is always a reminder that we all risk existing profits when we hold a position. Choosing to continue a trade that is profitable – is a choice that puts existing profits at risk. Just because a profit is unrealized doesn’t mean it isn’t real.
GOLD
Both the DEC18 and FEB19 Gold futures up $10.00 today, the FEB19 trading near $1218 and the DEC18 near $1212. The $US Dollar index ($DXY) was down today. I put up a chart in a recent post about the inverse correlation of $US and GC prices.
see: https://www.timefarming.com/blog/10-september-2018-monday/ if you want to review that chart with Gold vs. $US Index.
That is all today. Thank you for your support.- Don
Don’t forget, you can download a list of futures symbols and month codes at: Symbols/Codes
If you are trying to explain to any of your acquaintances what we do,

just send them a copy of this, a free download:
Download free now at: http://bit.ly/PFProfit
The commentary and examples are for teaching purposes only and are not intended to be a trading or trade advisory service. Any investments, trades, and/or speculations made in light of the ideas, opinions, and/or forecasts, expressed or implied herein on the web site and/or newsletter, are committed at your own risk, financial or otherwise. Trading with leverage could lead to greater loss than your initial deposit. Trade at your own risk. Investors and traders are responsible for their own investment/trading decisions including entries, exits, position, sizing and use of stops or lack thereof. This is not a trade advisory service and is for educational purposes only. The content on the pages here is believed to be reliable - but we cannot guarantee it.