04SEP2018 from Don A. Singletary
Greetings Subscribers: Starting today I’ll be posting some comments about existing trades (current positions) and notes on some possible trades to come. There is NOT a set schedule for these posts, but you can log in anytime and check for them. The DATE will always be in the post title and text.
As you know, our job as sellers of commodity options is to portend where price are NOT likely to go, almost the opposite of conventional trading that depends on amplitude and direction forecasting. With that in mind, let’s get started:
Soybean Options
Bearish news on Soybeans for this season continues. The recent yield estimate of 53.8 bush/acre seems to confirm less than stellar prices basis the NOV18 futures contract (North American harvest season.) Kansas State University’s post of the most recent WASDE (World Supply Demand Estimates) illustrates that not only are supplies abundant this year 2017-2018 (the blue vertical line), but also for next season (RED vertical line) 2018-2019.
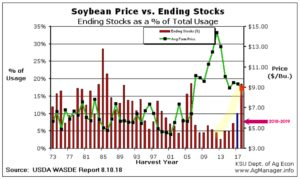
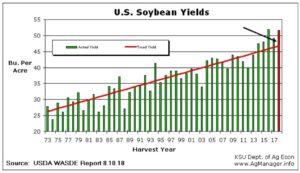
The trend of higher STU (stocks-to-use) is highlighted in yellow (above.) And (below) illustration KSU plotted the mutli-year very long term rise in bushels per acre yields since 1973:
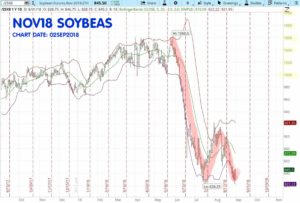
Since early June when the tariffs were announced, soybeans prices declined more than $2.00 per bushel. The NOV18 soybean futures prices dropped precipitously during JUN, then bounced from a low of $8.26.25 back up to around $9.20/bushel by the end of JUL, and now are about $8.45/ bushel this first week of SEP18.
With the average seasonal price expected to be around $9.00/bushel, beans probably can move up some – but likely not as high as $11.00/bushel by NOV18 option expiration, the third week of October, only 54 days out. This short time until expiration means there isn’t much premium available for selling NOV18 CALLs. 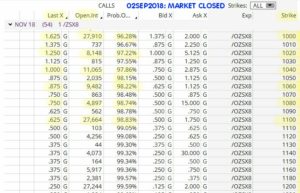
Here’s the Option Matrix for the NOV18 class of Soybean CALLS:
I’ve marked the LAST, OI, Prob.OTM of some of the strikes from 1100 down to 1000. It’s interesting that they are have a “Prob OTM” (probability of expiring Out-of-The-Money) of 96.28 or higher. For soybeans to move up 150 cents or more within the next 50 or so days is not likely. I will be watching this week to see if NOV18 soybeans move up a bit, enough to allow me to get a little more premium that is available for now. I’d like to get at least 1.0 to 1.5 for the 1100 CALL. The margin would probably be between $300 to $400 per options and I’d get a $50 credit minus a small commission. This would mean an ROI of about $46/$350 = 13.1% return in under two months. For things to go terribly wrong with this trade, the USA and China would have to solve tariff differences in the next 7 weeks. Keep in mind that more than $4 billion was approved for relief to USA farmers that were effected by tariffs imposed this summer.
30AUG2018 in the NEWS: USDA announced earlier this week that farmers would be able to begin applying for tariff aid at their local FSA offices beginning Sept. 4 as long as their commodities had been harvested and documented.
Some traders balk at selling such short-time option for this seemingly small amount of money. I actually understand why they might do that. Going out to early in 2019 and selling the 1100 CALL (underlying would be JAN19 Soybeans -/ZSF9) might be more attractive. I just looked at the 1000 JAN19 soybean CALL and it’s priced (last trade) at 4.5 cents, or about $225, and its Prob.OTM is about 91%. The expiration would be third week of DEC18, about 109 days out. This is probably a good trade also. Soybeans just dropped over 225 cents (JUN to AUG), then see-sawed up 90 cents, then down 75 cents —- and all that has happened since around June 1, 2018 only about 90 days ago. The point here being: the farther out in time a trader sells options, the more time there is for something to go wrong.
The next WASDE report at Noon Eastern time on 12th of September (WED). It is widely believed the numbers for ending stocks and production will not be revised much, which means no changes for the outlook (burdensome supplies.) There haven’t been this many soybeans available since the 2006-2007 season.
FYI: A free download with FUTURES SYMBOLS and MONTH CODES, UNIT VALUES, and MINIMUM TICK VALUE is now available at a link in this article:
https://sellingcommodityoptions.com/blog/futures-symbols-list/
Natural Gas
Just so you know (put this in your browser bookmarks), here’s the link for EIA.gov’s weekly Natural Gas Production Reports:
https://www.eia.gov/naturalgas/weekly/
Frankly, it isn’t a very exciting read there – and well, that is good news actually. If you compare this year to last year and look at the number of producing sites, the inventory, and how much NG is currently being pumped, there is nothing remarkable about this year compared to recent years. When you are in the business of selling options for income, this is great news — maybe just not fun reading. And THAT is what’s reflected in this chart of NOV18 NG futures prices:
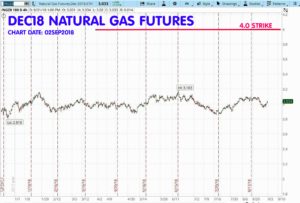
Last year the DEC17 contract of NG (NGZ7) never went over 3.35 after the first of SEP. I’m looking at selling the DEC18 NG 4.0 CALLs for 0.008 or better. Here’s the 15-year average seasonal price pattern for NG DEC contacts:
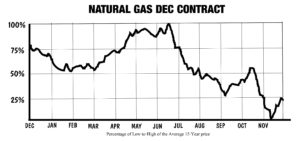
For sure the seasonal pattern for the DEC Natural Gas contract has some ‘up’s and down’s.’ These are often caused by changes in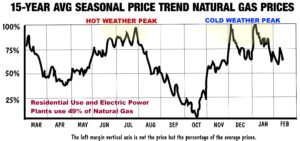 the weather. The chart on the right illustrates annual peak use months and average seasonal price behavior for NG (northern hemisphere temperature extremes each season).
49% of NG in USA used for electrical generation. The chart here is not for the DEC contact but the average of all contracts during the year.
The margin for trading NG is high compared to the grains (for example), that is because the contract value is a higher number. I have my eye on selling the 4.0 NGZ8 CALLs. They are trading for about 0.008. I’d like to get a little more for them but on the other hand, they only have about 85 days until expiration on November 27, 2018.
Other Bits and Pieces:
Gold: physical demand is down, but if the stock market turns down, a lot of ‘safe-haven’ money might be shifted to precious metals. I am currently short a Gold strangle: DEC18 short 1400 CALL and short DEC18 1050 PUT. Originally, I sold the 1700C, then I took profits on it as gold went down, and replaced that CALL side of the strangle with the 1400 CALL on 8/23/2018 (see trade summary sheet.)
Corn: This one could be on the verge of a counter-seasonal move. The 15 year pattern of price average for DEC contracts is down, however demand is high and the plantings have been getting smaller for a while due to lower prices. There’s a saying in futures trading: The cure for lower prices is lower prices. The plantings decrease when prices are down, in turn – this eventually causes less supply and brings higher prices (supply-demand 101). Demand for corn has been increasing while production has 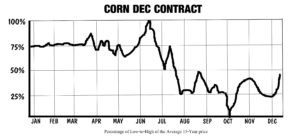 decreased. At present 5.6 billion bushels of corn go to ethanol fuel additive production. The STU for next season’s 2018-2019 crop could be the lowest since 2013-2014. As I mentioned before the new supply-demand (WASDE from USDA) is coming up 12 SEP 2018. I’ve already made money with a back ratio spread recently (see Trade Summary Sheet 8/16/2018 entry.) A ratio-credit spread could be just the strategy to use on Corn again, since the prices could move UP in the short term, and if I can sell a strike high enough that corn isn’t likely to reach it, there could be a trade there I’m willing to take. More on this coming soon. DEC18 Corn prices were up 9.50 on Friday and a further run up – could bring a good opportunity. I’ll be watching. I suspect it might run up more prior to the 12th SEP WASDE report.
Crude Oil:
I am currently short this strangle: Crude Oil DEC18 90-CALL and DEC18 50-PUT. This trade is up a bit and doing well. Both sides are nearing the 50% profit (of the premium sold) point. I don’t necessarily always take the 50% of premium but I always remember I am putting up those “already earned” profits now- on each and every day I choose to keep the trade open – while trying to make a little more. I commented on this hazard in a blog article I posted just a few days ago on 8/31/2018, please see: https://sellingcommodityoptions.com/blog/option-trading-rules/ RULES OF THUMB for option sellers.
Last Comment Today:
This TRADE COMMENTARY page is new and I’ll be posting ideas and thoughts as well as some charts and data here about present trades and items I’m watching for my futures trades. I like the idea of writing this column on the weekend and posting it the first trading day of the week. Then during that week, I plan on either adding something new or following up once more in the middle of the week (perhaps on WED.) If you have suggestions or comments, please email them directly to me and I can answer personally. I do not plan on having a full question/answer forum in TRADE COMMENTARY, but if you email me with a comment or question that is useful for all subscribers, I can post information (while you remain confidential of course) that might be helpful to all or most subscribers. Your feedback is welcomed.
Now that this new website is up and running, anyone can start a free trial account and gain access immediately to 3 months of back issues, this TRADE COMMENTARY column, and will receive two months of the newsletter in real time. I will continue to send emails to subscribers when a new issue of TIME FARMING TRAINING BULLETIN is posted here for download. You must log in to download it. It will no longer be attached to your notification email.
I hope you will consider telling a friend about our newsletter. NOW, they can get access immediately when they register for the FREE trial. Thank you and good trading. – Don

Don A. Singletary
The commentary and examples are for teaching purposes only and are not intended to be a trading or trade advisory service. Any investments, trades, and/or speculations made in light of the ideas, opinions, and/or forecasts, expressed or implied herein on the web site and/or newsletter, are committed at your own risk, financial or otherwise. Trading with leverage could lead to greater loss than your initial deposit. Trade at your own risk. Investors and traders are responsible for their own investment/trading decisions including entries, exits, position, sizing and use of stops or lack thereof. This is not a trade advisory service and is for educational purposes only. The content on the pages here is believed to be reliable - but we cannot guarantee it.


04SEP2018 from Don A. Singletary
Greetings Subscribers: Starting today I’ll be posting some comments about existing trades (current positions) and notes on some possible trades to come. There is NOT a set schedule for these posts, but you can log in anytime and check for them. The DATE will always be in the post title and text.
As you know, our job as sellers of commodity options is to portend where price are NOT likely to go, almost the opposite of conventional trading that depends on amplitude and direction forecasting. With that in mind, let’s get started:
Soybean Options
Bearish news on Soybeans for this season continues. The recent yield estimate of 53.8 bush/acre seems to confirm less than stellar prices basis the NOV18 futures contract (North American harvest season.) Kansas State University’s post of the most recent WASDE (World Supply Demand Estimates) illustrates that not only are supplies abundant this year 2017-2018 (the blue vertical line), but also for next season (RED vertical line) 2018-2019.
The trend of higher STU (stocks-to-use) is highlighted in yellow (above.) And (below) illustration KSU plotted the mutli-year very long term rise in bushels per acre yields since 1973:
Since early June when the tariffs were announced, soybeans prices declined more than $2.00 per bushel. The NOV18 soybean futures prices dropped precipitously during JUN, then bounced from a low of $8.26.25 back up to around $9.20/bushel by the end of JUL, and now are about $8.45/ bushel this first week of SEP18.
With the average seasonal price expected to be around $9.00/bushel, beans probably can move up some – but likely not as high as $11.00/bushel by NOV18 option expiration, the third week of October, only 54 days out. This short time until expiration means there isn’t much premium available for selling NOV18 CALLs.
Here’s the Option Matrix for the NOV18 class of Soybean CALLS:
I’ve marked the LAST, OI, Prob.OTM of some of the strikes from 1100 down to 1000. It’s interesting that they are have a “Prob OTM” (probability of expiring Out-of-The-Money) of 96.28 or higher. For soybeans to move up 150 cents or more within the next 50 or so days is not likely. I will be watching this week to see if NOV18 soybeans move up a bit, enough to allow me to get a little more premium that is available for now. I’d like to get at least 1.0 to 1.5 for the 1100 CALL. The margin would probably be between $300 to $400 per options and I’d get a $50 credit minus a small commission. This would mean an ROI of about $46/$350 = 13.1% return in under two months. For things to go terribly wrong with this trade, the USA and China would have to solve tariff differences in the next 7 weeks. Keep in mind that more than $4 billion was approved for relief to USA farmers that were effected by tariffs imposed this summer.
Some traders balk at selling such short-time option for this seemingly small amount of money. I actually understand why they might do that. Going out to early in 2019 and selling the 1100 CALL (underlying would be JAN19 Soybeans -/ZSF9) might be more attractive. I just looked at the 1000 JAN19 soybean CALL and it’s priced (last trade) at 4.5 cents, or about $225, and its Prob.OTM is about 91%. The expiration would be third week of DEC18, about 109 days out. This is probably a good trade also. Soybeans just dropped over 225 cents (JUN to AUG), then see-sawed up 90 cents, then down 75 cents —- and all that has happened since around June 1, 2018 only about 90 days ago. The point here being: the farther out in time a trader sells options, the more time there is for something to go wrong.
The next WASDE report at Noon Eastern time on 12th of September (WED). It is widely believed the numbers for ending stocks and production will not be revised much, which means no changes for the outlook (burdensome supplies.) There haven’t been this many soybeans available since the 2006-2007 season.
Natural Gas
Just so you know (put this in your browser bookmarks), here’s the link for EIA.gov’s weekly Natural Gas Production Reports:
https://www.eia.gov/naturalgas/weekly/
Frankly, it isn’t a very exciting read there – and well, that is good news actually. If you compare this year to last year and look at the number of producing sites, the inventory, and how much NG is currently being pumped, there is nothing remarkable about this year compared to recent years. When you are in the business of selling options for income, this is great news — maybe just not fun reading. And THAT is what’s reflected in this chart of NOV18 NG futures prices:
Last year the DEC17 contract of NG (NGZ7) never went over 3.35 after the first of SEP. I’m looking at selling the DEC18 NG 4.0 CALLs for 0.008 or better. Here’s the 15-year average seasonal price pattern for NG DEC contacts:
For sure the seasonal pattern for the DEC Natural Gas contract has some ‘up’s and down’s.’ These are often caused by changes in the weather. The chart on the right illustrates annual peak use months and average seasonal price behavior for NG (northern hemisphere temperature extremes each season).
49% of NG in USA used for electrical generation. The chart here is not for the DEC contact but the average of all contracts during the year.
The margin for trading NG is high compared to the grains (for example), that is because the contract value is a higher number. I have my eye on selling the 4.0 NGZ8 CALLs. They are trading for about 0.008. I’d like to get a little more for them but on the other hand, they only have about 85 days until expiration on November 27, 2018.
Other Bits and Pieces:
Gold: physical demand is down, but if the stock market turns down, a lot of ‘safe-haven’ money might be shifted to precious metals. I am currently short a Gold strangle: DEC18 short 1400 CALL and short DEC18 1050 PUT. Originally, I sold the 1700C, then I took profits on it as gold went down, and replaced that CALL side of the strangle with the 1400 CALL on 8/23/2018 (see trade summary sheet.)
Corn: This one could be on the verge of a counter-seasonal move. The 15 year pattern of price average for DEC contracts is down, however demand is high and the plantings have been getting smaller for a while due to lower prices. There’s a saying in futures trading: The cure for lower prices is lower prices. The plantings decrease when prices are down, in turn – this eventually causes less supply and brings higher prices (supply-demand 101). Demand for corn has been increasing while production has decreased. At present 5.6 billion bushels of corn go to ethanol fuel additive production. The STU for next season’s 2018-2019 crop could be the lowest since 2013-2014. As I mentioned before the new supply-demand (WASDE from USDA) is coming up 12 SEP 2018. I’ve already made money with a back ratio spread recently (see Trade Summary Sheet 8/16/2018 entry.) A ratio-credit spread could be just the strategy to use on Corn again, since the prices could move UP in the short term, and if I can sell a strike high enough that corn isn’t likely to reach it, there could be a trade there I’m willing to take. More on this coming soon. DEC18 Corn prices were up 9.50 on Friday and a further run up – could bring a good opportunity. I’ll be watching. I suspect it might run up more prior to the 12th SEP WASDE report.
Crude Oil:
I am currently short this strangle: Crude Oil DEC18 90-CALL and DEC18 50-PUT. This trade is up a bit and doing well. Both sides are nearing the 50% profit (of the premium sold) point. I don’t necessarily always take the 50% of premium but I always remember I am putting up those “already earned” profits now- on each and every day I choose to keep the trade open – while trying to make a little more. I commented on this hazard in a blog article I posted just a few days ago on 8/31/2018, please see: https://sellingcommodityoptions.com/blog/option-trading-rules/ RULES OF THUMB for option sellers.
Last Comment Today:
This TRADE COMMENTARY page is new and I’ll be posting ideas and thoughts as well as some charts and data here about present trades and items I’m watching for my futures trades. I like the idea of writing this column on the weekend and posting it the first trading day of the week. Then during that week, I plan on either adding something new or following up once more in the middle of the week (perhaps on WED.) If you have suggestions or comments, please email them directly to me and I can answer personally. I do not plan on having a full question/answer forum in TRADE COMMENTARY, but if you email me with a comment or question that is useful for all subscribers, I can post information (while you remain confidential of course) that might be helpful to all or most subscribers. Your feedback is welcomed.
Now that this new website is up and running, anyone can start a free trial account and gain access immediately to 3 months of back issues, this TRADE COMMENTARY column, and will receive two months of the newsletter in real time. I will continue to send emails to subscribers when a new issue of TIME FARMING TRAINING BULLETIN is posted here for download. You must log in to download it. It will no longer be attached to your notification email.
I hope you will consider telling a friend about our newsletter. NOW, they can get access immediately when they register for the FREE trial. Thank you and good trading. – Don
Don A. Singletary
The commentary and examples are for teaching purposes only and are not intended to be a trading or trade advisory service. Any investments, trades, and/or speculations made in light of the ideas, opinions, and/or forecasts, expressed or implied herein on the web site and/or newsletter, are committed at your own risk, financial or otherwise. Trading with leverage could lead to greater loss than your initial deposit. Trade at your own risk. Investors and traders are responsible for their own investment/trading decisions including entries, exits, position, sizing and use of stops or lack thereof. This is not a trade advisory service and is for educational purposes only. The content on the pages here is believed to be reliable - but we cannot guarantee it.