
Greetings: 10 Oct 2019, Thursday.
Just a quick update after the USDA / WASDE report today. DEC19 Corn futures at 12:12 PM ET today down 9.50 cents at 385.
If you want the “short version”: Little change, though the avg. to farm price went from 360 to 380 (where it had been earlier.) This was due to adjustments of exports and usage.
In next weeks TRADE COMMENTARY, I’ll put up the charts and discuss this in more detail. Now, at 12:22 PM, DEC19 trading 382, down -12.25 cents/bushel. Thanks – Don
Here’s an excerpt from today’s report: (available at: https://www.usda.gov/oce/commodity/wasde/
My suggestion is you download the PDF version and print the pages you need from there. I’m not sure these columns will hold up for mobile viewing (you may have to scroll to right margin to read it), so just download the PDF and compare SEP and OCT numbers, you will see they are almost no change or ‘small changes’ overall. You have to scroll down quite a few pages to find “coarse grains and corn” tables.
 U.S. Feed Grain and Corn Supply and Use  1/
================================================================================
                               2017/18  2018/19 Est. 2019/20 Proj. 2019/20 Proj.
Item                                                           Sep           Oct
================================================================================
                                                 Million Acres
FEED GRAINS
Area Planted                     100.9         100.1         100.7         100.7
Area Harvested                    90.5          89.6          90.0          89.6

                                                 Metric Tons
Yield per Harvested Acre          4.24          4.24          4.05          4.06

                                               Million Metric Tons
Beginning Stocks                  62.1          57.9          65.9          57.8
Production                       384.1         379.7         364.1         363.4
Imports                            2.7           2.3           3.2           3.1
  Supply, Total                  449.0         440.0         433.2         424.3
Feed and Residual                138.6         147.6         137.4         140.3
Food, Seed & Industrial          185.3         179.7         181.8         180.1
  Domestic, Total                323.9         327.3         319.1         320.4
Exports                           67.2          54.9          54.7          50.9
  Use, Total                     391.1         382.2         373.9         371.3
Ending Stocks                     57.9          57.8          59.4          53.0

                                                 Million Acres

CORN
Area Planted                      90.2          89.1          90.0          89.9
Area Harvested                    82.7          81.7          82.0          81.8

                                                  Bushels
Yield per Harvested Acre         176.6         176.4         168.2         168.4

                                                Million Bushels
Beginning Stocks                  2293          2140          2445          2114
Production                       14609         14420         13799         13779
Imports                             36            28            50            50
  Supply, Total                  16939         16588         16295         15944
Feed and Residual                 5304          5618          5175          5300
Food,Seed& Industrial 2/          7057          6791          6880          6815
Ethanol & by-products 3/          5605          5376          5450          5400
  Domestic, Total                12361         12409         12055         12115
Exports                           2438          2065          2050          1900
  Use, Total                     14798         14474         14105         14015
Ending Stocks                     2140          2114          2190          1929
Avg.FarmPrice ($/bu)  4/          3.36          3.61          3.60          3.80
================================================================================
                                WASDE - 593 - 13                    October 2019
Good news for short 420 DEC19 Corn CALLS. When Kansas State Univ put out the charts update, I’ll present it here. – Don
Trial Subscribers: Subscribe today and don’t miss an issue. Thank you.
click here OR the picture below.


Don A. Singletary
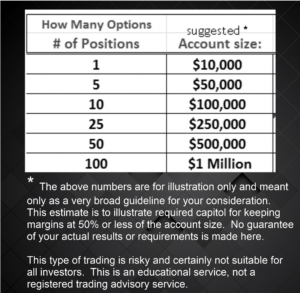

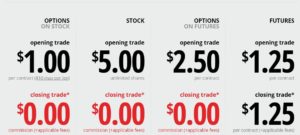
When new subscribers ask me to recommend a broker that has very easy-to-learn and easy-to-use software (free of course) and a good commission rate, I recommend TastyWorks. I have some of my personal accounts there. They also have a low 85 cents commission rate on the new Micro Index Futures; this is only $2.42 INCLUDING ALL FEES / ROUND TRIP .
TastyWorks: $2,000 minimum to open account. Easy online application, free ACH money transfers. Here’s my affiliate link for TASTYWORKS. International Accounts for 70 countries available.


***************
The commentary and examples are for teaching purposes only and are not intended to be a trading or trade advisory service. Any investments, trades, and/or speculations made in light of the ideas, opinions, and/or forecasts, expressed or implied herein on the web site and/or newsletter, are committed at your own risk, financial or otherwise. Trading with leverage could lead to greater loss than your initial deposit. Trade at your own risk. Investors and traders are responsible for their own investment/trading decisions including entries, exits, position, sizing and use of stops or lack thereof. This is not a trade advisory service and is for educational purposes only. The content on the pages here is believed to be reliable - but we cannot guarantee it.